This article was co-authored by David Jia. David Jia is an Academic Tutor and the Founder of LA Math Tutoring, a private tutoring company based in Los Angeles, California. With over 10 years of teaching experience, David works with students of all ages and grades in various subjects, as well as college admissions counseling and test preparation for the SAT, ACT, ISEE, and more. After attaining a perfect 800 math score and a 690 English score on the SAT, David was awarded the Dickinson Scholarship from the University of Miami, where he graduated with a Bachelor’s degree in Business Administration. Additionally, David has worked as an instructor for online videos for textbook companies such as Larson Texts, Big Ideas Learning, and Big Ideas Math.
There are 8 references cited in this article, which can be found at the bottom of the page.
This article has been viewed 133,882 times.
A graph of a function is a visual representation of a function's behavior on an x-y plane. Graphs help us understand different aspects of the function, which would be difficult to understand by just looking at the function itself. You can graph thousands of equations, and there are different formulas for each one. That said, there are always ways to graph a function if you forget the exact steps for the specific type of function.
Steps
Graphing Linear Equations with Slope
-
1Recognize linear functions as simple, easily-graphed lines, like . There is one variable and one constant, written as in a linear function, with no exponents, radicals, etc. If you've got a simple equation like this, then graphing the function is easy.[1] Other examples of linear functions include:
-
2Use the constant to mark your y-intercept. The y-intercept is where the function crosses the y-axis on your graph. In other words, it is the point where . So, to find it, you simply set x to zero, leaving the constant in the equation alone. For the earlier example, , your y-intercept is 5, or the point (0,5). On your graph, mark this spot with a dot.[2]Advertisement
-
3Find the slope of your line with the number right before the variable. In your example, , the slope is "2." That is because 2 is right before the variable in the equation, the "x." Slope is how steep a line is, or how high the line goes before going to the right or left. Bigger slopes mean steeper lines.
-
4Break the slope into a fraction. Slope is about steepness, and steepness is simply the difference between movement up and down and movement left and right. Slope is a fraction of rise over run. How much does the line "rise" (go up) before it "runs" (goes to the side)? For the example, the slope of "2" could be read as .[3]
- If the slope is negative, that means the line goes down as you move to the right.
-
5Starting at your y-intercept, follow your "rise" and "run" to graph more points. Once you know your slope, use it to plot out your linear function. Start at your y-intercept, here (0,5), and then move up 2, over 1. Mark this point (1,7) as well. Find 1-2 more points to create an outline of your line.[4]
-
6Use a ruler to connect your dots and graph your linear function. To prevent mistakes or rough graphs, find and connect at least three separate points, though two will do in a pinch. This is the graph of your linear equation![5]


Estimating Points on a Graph
-
1Determine the function. Get the function of the form like f(x), where y would represent the range, x would represent the domain, and f would represent the function. As an example, we'll use y = x+2, where f(x) = x+2.[6]
-
2Draw two lines in a + shape on a piece of paper. The horizontal line is your x axis. The vertical line is your y axis.
-
3Number your graph. Mark both the x axis and the y axis with equally-spaced numbers. For the x axis, the numbers are positive on the right side and negative on the left side. For the y axis, the numbers are positive on the upper side and negative on the lower side.[7]
-
4Calculate a y value for 2-3 x values. Take your function f(x) = x+2. Calculate a few values for y by putting the corresponding values for x visible on the axis into the function. For more complicated equations, you may want to simplify the function by getting one variable isolated first.[8]
- -1: -1 + 2 = 1
- 0: 0 +2 = 2
- 1: 1 + 2 = 3
-
5Draw the graph point for each pair. Simply sketch imaginary lines vertically for each x axis value and horizontally for each y axis value. The point where these lines intersect is a graph point.[9]
-
6Remove the imaginary lines. Once you have drawn all the graph points, you can erase the imaginary lines. Note: the graph of f(x) = x would be a line parallel to this one passing through the origin (0,0), but f(x) = x+2 is shifted two units up (along the y-axis) on the grid because of the +2 in the equation.[10]


Graphing Complicated Functions by Hand
-
1Understand how to graph common equation types. There are as many different graphing strategies out there as there are types of functions, far too many to completely cover here. If you're struggling, and estimations won't work, check out articles on:
- Quadratic functions
- Rational functions
- Logarithmic functions
- Graphing inequalities (not functions, but still useful information).
-
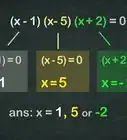
2Find any zeros first. Zeros, also called x-intercepts, are the points where the graph crosses the horizontal line on the graph. While not all graphs even have zeros, most do, and it is the first step you should take to get everything on track. To find zeros, simply the entire function to zero and solve. For example:
- Set F(x) equal to zero:
- Solve:
-
3Find and mark any horizontal asymptotes, or places where it is impossible for the function to go, with a dotted line. This is usually points where the graph does not exist, like where you are dividing by zero. If your equation has a variable in a fraction, like , start by setting the bottom of the fraction to zero. Any places where it equals zero can be dotted off (in this example, a dotted line at x=2 and x=-2), since you cannot ever divided by zero. Fractions, however, are not the only places you can find asymptotes. Usually, all you need is some common sense:
- Some squared functions, like can never be negative. Thus there is an asymptote at 0.
- Unless you're working with imaginary numbers, you cannot have [12]
- For equations with complex exponents, you may have many asymptotes.
-
4Plug in and graph several points. Simply pick a few values for x and solve the function. Then graph the points on your graph. The more complicated the graph, the more points you'll need. In general, -1, 0, and 1 are the easiest points to get, though you'll want 2-3 more on either side of zero to get a good graph.[13]
- For the equation , you might plug in -1,0,1, -2, 2, -10, and 10. This gives you a nice range of numbers to compare.
- Be smart selecting numbers. In the example, you'll quickly realize that having a negative sign doesn't matter -- you can stop testing -10, for example, because it will be the same as 10.
-
5Map the end behavior of the function to see what happens when it is really huge. This gives you an idea of the general direction of a function, usually as a vertical asymptote. For example -- you know that eventually, gets really, really big. Just one additional "x" (one million vs. one million and one) makes y much bigger. There are a few ways to test end behavior, including:
- Plug in 2-4 large values of x, half negative and half positive, and plot the points.
- What happens if you plugged in "infinity" for one variable? Does the function get infinitely bigger or smaller?
- If the degrees are the same in a fraction, like , simply divide the first two coefficients ( to get your ending asymptote (-.5).[14]
- If the degrees are different in a fraction, you must divide the equation in the numerator by the equation in denominator by Polynomial Long Division.
-
6Connect the dots, avoiding asymptotic and following the end behavior to graph an estimate of the function. Once you have 5-6 points, asymptotes, and a general idea of end behavior, plug it all in to get an estimated version of the graph.[15]
-
7Get perfect graphs using a graphing calculator. Graphing calculators are powerful pocket computers that can give exact graphs for any equation. They allow you to search exact points, find slope lines, and visualize difficult equations with ease. Simply input the exact equation into the graphing section (usually a button labeled "F(x) = ") and hit graph to see your function at work.


Community Q&A
-
QuestionHow do I sketch a graph of a square root function?
 DonaganTop AnswererThe process is the same as shown in the article above except, of course, it involves calculating (or estimating) the square roots of certain values.
 -
QuestionHow do I graph function y = -2 sin(2/3x)?DonaganTop AnswererChoose a value for x. Find 2/3 of that value. Then use a trigonometry table to find the sine of that last value. Then multiply the sine by -2. That gives you the value of y that corresponds to the chosen value of x. Do this again for other x values, and you will then have several x-y pairs to form the graph of the function.


References
- ↑ https://courses.lumenlearning.com/waymakercollegealgebra/chapter/graph-linear-functions/
- ↑ https://www.cuemath.com/calculus/linear-functions/
- ↑ https://www.cuemath.com/calculus/linear-functions/
- ↑ https://courses.lumenlearning.com/waymakercollegealgebra/chapter/graph-linear-functions/
- ↑ https://www.cuemath.com/calculus/linear-functions/
- ↑ https://www.cuemath.com/calculus/graphing-functions/
- ↑ https://www.wtamu.edu/academic/anns/mps/math/mathlab/int_algebra/int_alg_tut14_lineargr.htm
- ↑ https://www.wtamu.edu/academic/anns/mps/math/mathlab/int_algebra/int_alg_tut14_lineargr.htm
- ↑ https://www.cuemath.com/calculus/graphing-functions/
- ↑ http://tutorial.math.lamar.edu/Classes/Alg/GraphFunctions.aspx
- ↑ http://tutorial.math.lamar.edu/Classes/Alg/GraphFunctions.aspx
- ↑ http://www.purplemath.com/modules/grphrtnl.htm
- ↑ http://www.purplemath.com/modules/grphrtnl.htm
- ↑ http://www.purplemath.com/modules/asymtote2.htm
- ↑ https://tutorial.math.lamar.edu/classes/alg/graphrationalfcns.aspx
About This Article

To graph a function, start by plugging in 0 for x and then solving the equation to find y. Then, mark that spot on the y-axis with a dot. Next, find the slope of the line, which is the number that's right before the variable. Once you know your slope, write it as a fraction over 1 and then use the rise over run to plot the rest of the points from the spot you marked on the y-axis. Finally, use a ruler to draw a line connecting all of the points on your graph. To learn how to graph complicated functions by hand, scroll down!