This article was co-authored by David Jia. David Jia is an Academic Tutor and the Founder of LA Math Tutoring, a private tutoring company based in Los Angeles, California. With over 10 years of teaching experience, David works with students of all ages and grades in various subjects, as well as college admissions counseling and test preparation for the SAT, ACT, ISEE, and more. After attaining a perfect 800 math score and a 690 English score on the SAT, David was awarded the Dickinson Scholarship from the University of Miami, where he graduated with a Bachelor’s degree in Business Administration. Additionally, David has worked as an instructor for online videos for textbook companies such as Larson Texts, Big Ideas Learning, and Big Ideas Math.
There are 14 references cited in this article, which can be found at the bottom of the page.
This article has been viewed 149,185 times.
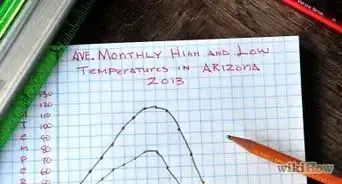
Graphing equations is a much simpler process that most people realize. You don't have to be a math genius or straight-A student to learn the basics of graphing without using a calculator. Learn a few of these methods for graphing linear, quadratic, inequality, and absolute value equations.
Steps
Graphing Linear Equations
-
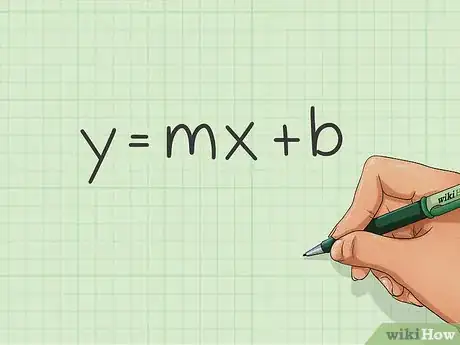
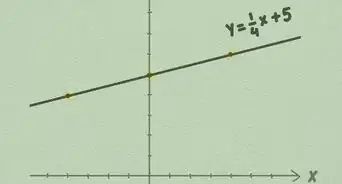
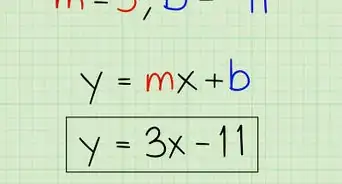
1Use the y=mx+b formula. To graph a linear equation, all you have to do it substitute in the variables in this formula.[1]
- In the formula, you will be solving for (x,y).
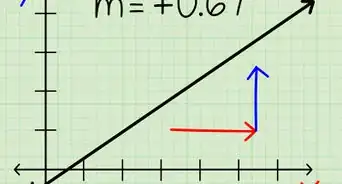
- The variable m= slope. The slope is also noted as rise over run, or the number of points you travel up and over.
- In the formula, b= y-intercept. This is the place on your graph where the line will cross over the y-axis.
-
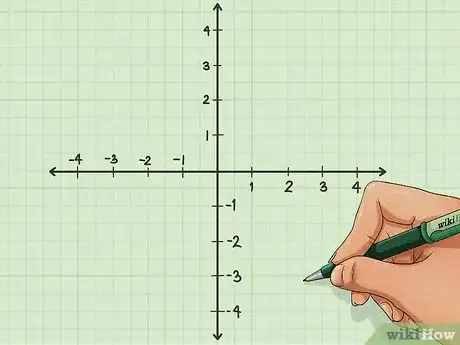
2Draw your graph. Graphing a linear equation is the most simple, as you don’t have to calculate any numbers prior to graphing. Simply draw your Cartesian coordinate plane.[2]Advertisement
-
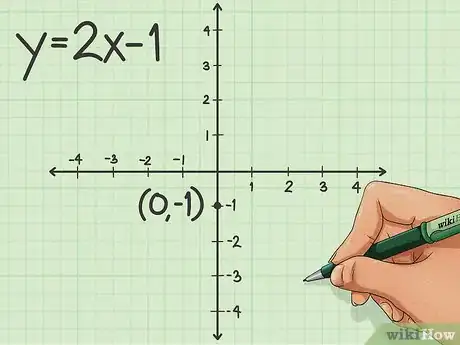
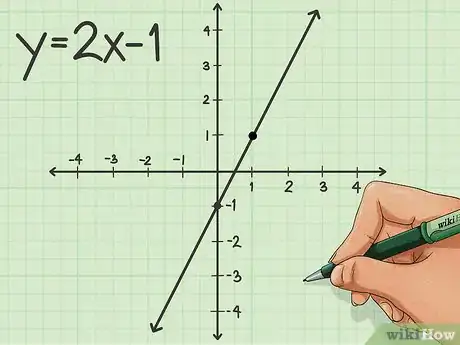
3Find the y-intercept (b) on your graph. If we use the example of y=2x-1, we can see that ‘-1’ is in the point on the equation where you would find ‘b.’ This makes ‘-1’ the y-intercept.[3]
- The y-intercept is always graphed with x=0. Therefore, the y-intercept coordinates are (0,-1).
- Place a point on your graph where the y-intercept should be.
-
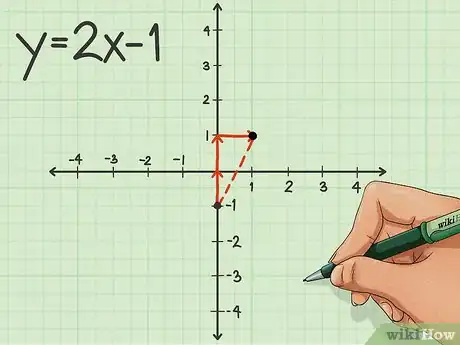
4Find the slope. In the example of y=2x-1, the slope is the number where ‘m’ would be found. That means that according to our example, the slope is ‘2.’ Slope, however, is the rise over run, so we need the slope to be a fraction. Because ‘2’ is a whole number and a fraction, it is simply ‘2/1.’[4]
- To graph the slope, begin at the y-intercept. The rise (number of spaces up) is the numerator of the fraction, while the run (number of spaces to the side) is the denominator of the fraction.
- In our example, we would graph the slope by beginning at -1, and then moving up 2 and to the right 1.
- A positive rise means that you will move up the y-axis, while a negative rise means you will move down. A positive run means you will move to the right of the x-axis, while a negative run means you will move to the left of the x-axis.
- You can mark as many coordinates using the slope as you would like, but you must mark at least one.
-
5Draw your line. Once you have marked at least one other coordinate using the slope, you can connect it with your y-intercept coordinate to form a line. Extend the line to the edges of the graph, and add arrow points to the ends to show that it continues infinitely.[5]
Graphing Single-Variable Inequalities
-
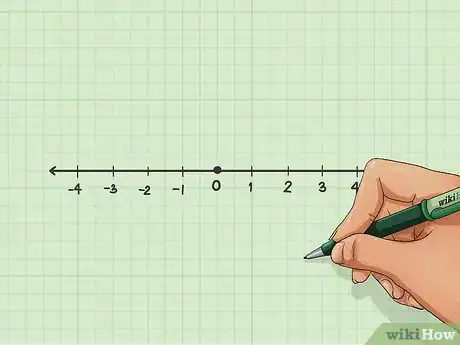
1Draw a number line. Because single-variable inequalities only occur on one axis, you don’t have to use Cartesian coordinates. Instead, draw a simple number line.[6]
-
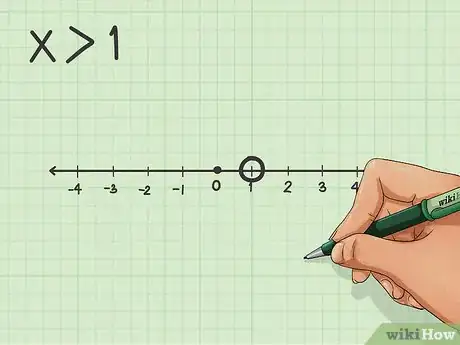
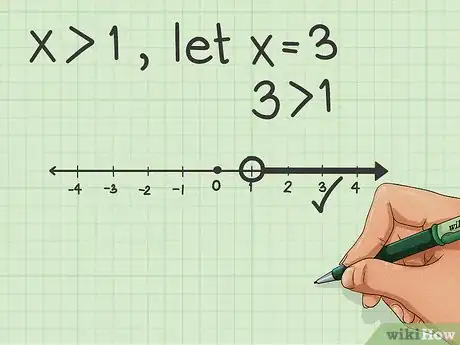
2Graph your inequality. These are pretty simple, because they only have one coordinate. You will be given an inequality such as x<1 to graph. To do this, first find ‘1’ on your number line.[7]
- If you are given a “greater than” symbol, which is either > or <, then draw an open circle around the number.
- If you are given a “greater than or equal to” symbol, either > or <, then fill in the circle around your point.
-
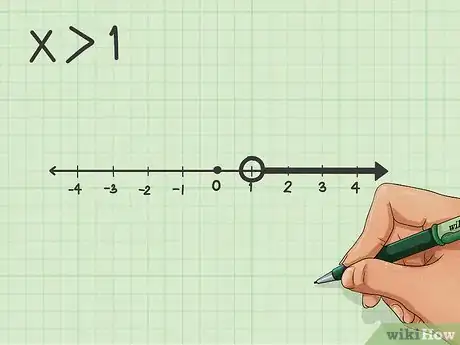
3Draw your line. Using the point you just made, follow the inequality symbol to draw a line representing the inequality. If it is ‘greater than’ the point, then the line will go to the right. If it is ‘less than’ the point, then the line will be drawn to the left. Add an arrow to the end to show that the line continues and is not a segment.[8]
-
4Check your answer. Substitute in any number to equal ‘x’ and mark it on your number line. If this number lies on the line you have drawn, your graph is accurate.
Graphing Linear Inequalities
-
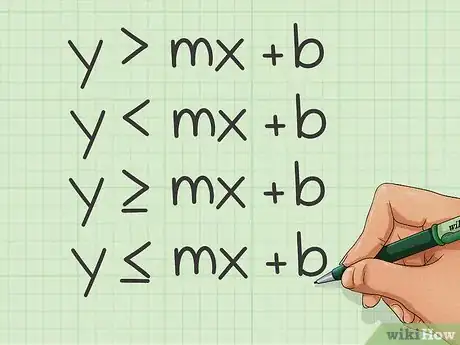
1Use the slope intercept form. This is the same formula used to graph regular linear equations, but instead of an ‘=’ sign being used, you will be given an inequality sign. The inequality sign will either be <, >, <, or >.[9]
- Slope intercept form is y=mx+b, where m=slope and b=y-intercept.
- Having an inequality present means that there are multiple solutions.
-
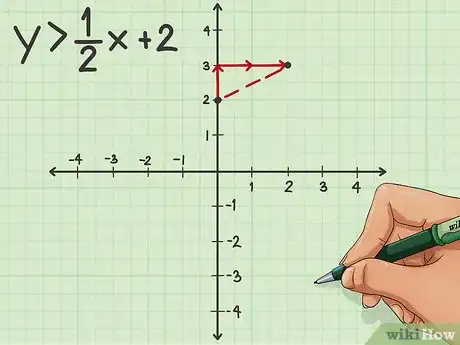
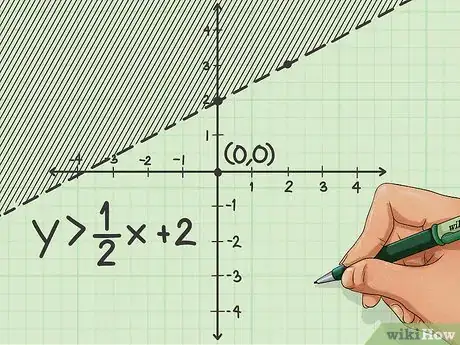
2Graph the inequality. Find the y-intercept and the slope to mark your coordinates. If we use the example of y>1/2x+2, then the y-intercept is ‘2’. The slope is ½, meaning you move up one point and to the right two points.[10]
-
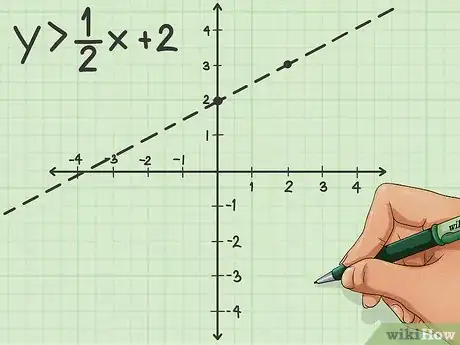
3Draw your line. Before you draw it though, check the inequality symbol that is being used. If it is a “greater than” symbol, your line should be dashed. If it is a “greater than or equal to” symbol, your line should be solid.[11]
-
4Shade your graph. Because there are multiple solutions to an inequality, you must show all possible solutions on your graph. This means you will shade all of your graph above or below your line.
- Choose a coordinate - the origin at (0,0) is often the easiest. Make sure that you note if this coordinate is above or below the line you’ve drawn.
- Substitute these coordinates into your inequality. Following our example, it would be 0>1/2(0)+1. Solve this inequality.
- If the coordinate pair is a point above your line and the answer is true, then you would shade above the line. If the answer to the inequality is false, then you would shade below the line. If the coordinate lies below your line and the answer is true, then you shade below your line. If your answer is false, then shade above our line.
- In our example, (0,0) is below our line and creates a false solution when substituted into the inequality. That means that we shade the remainder of the graph above the line.[12]
Graphing Quadratic Equations
-
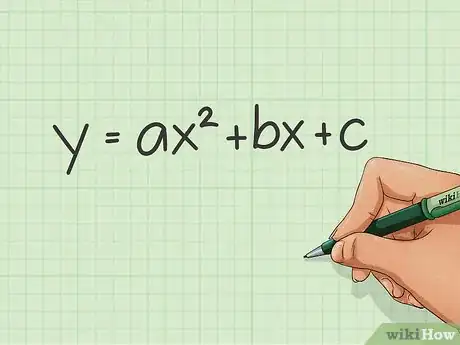
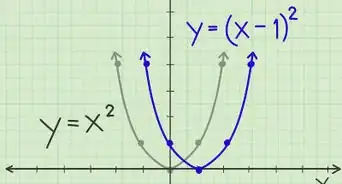
1Examine your formula. A quadratic equation means that you have at least one variable that is squared. It will typically be written in the formula y=ax(squared)+bx+c.[13]
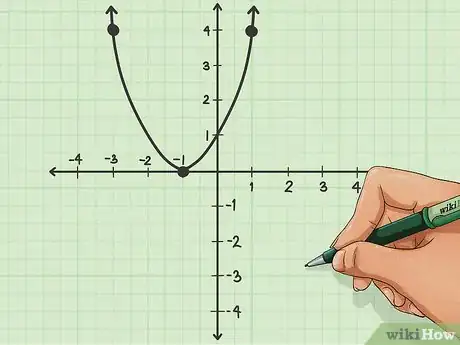
- Graphing a quadratic equation will give you a parabola, which is a ‘U’ shaped curve.
- You will need to find at least three point to graph it, beginning with the vertex which is the centermost point.
-
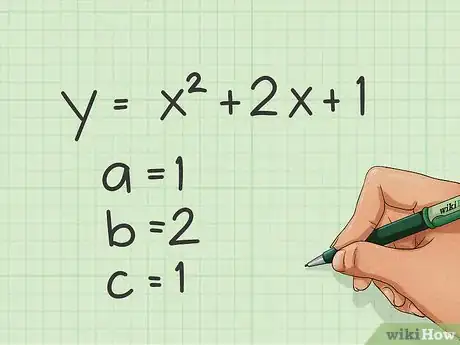
2Find ‘a,’ ‘b,’ and ‘c’. If we use the example y=x(squared)+2x+1, then a=1, b=2, and c=1. Each letter corresponds to the number directly before the variable it sits next to in the equation. If there is no number before ‘x’ in the equation, then the variable is equal to ‘1’ because it is assumed that there is 1x.[14]
-
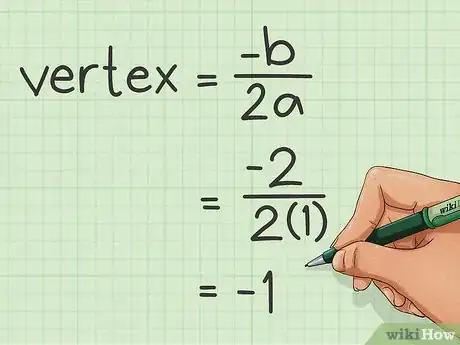
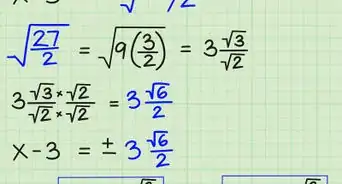
3Find the vertex. To find the vertex, the point in the middle of the parabola, use the formula -b/2a. In our example, this equation would change to -2/2(1), which equals to -1.[15]
-
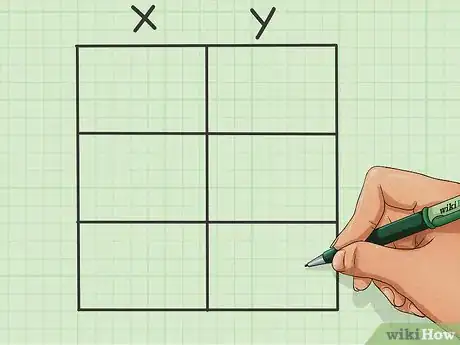
4Make a table. You now know the vertex, -1, which is a point on the x-axis. However, this is only one point of the vertex coordinate. To find the corresponding y-coordinate as well as two other points on your parabola, you will need to make a table.[16]
-
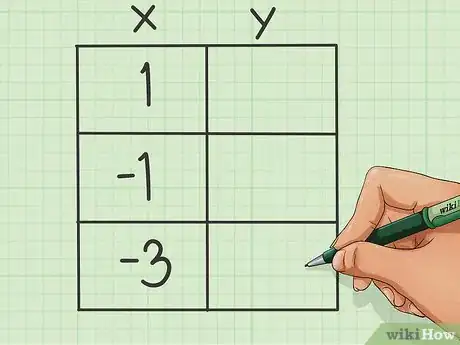
5Make a table that has three rows and two columns.[17]
- Place the x-coordinate for the vertex in the top center column.
- Choose two more x-coordinates an equal number in each direction (positive and negative) from the vertex point. For example, we could go up two and down two, making the two numbers we fill in the other blank table spaces ‘-3’ and ‘1’.
- You can choose any numbers you want to fill in the top row of the table, as long as they are whole numbers and the same distance from the vertex.
- If you want to have a clearer graph, you can find five coordinates instead of three. Doing this is the same process as above, but give your table five columns instead of three.
-
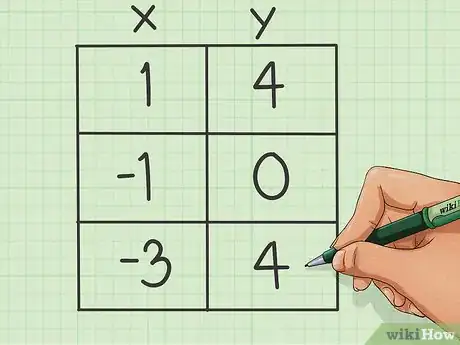
6Use your table and formula to solve for the y-coordinates. One at a time, take the numbers you have selected to represent the x-coordinates from your table and insert them into the original equation. Solve for ‘y’.[18]
- Following our example, we could use our chosen coordinate of ‘-3’ to substitute into the original formula of y=x(squared)+2x+1. This would change to y= -3(squared)+2(3)+1, giving an answer of y=4.
- Place the new y-coordinate underneath the x-coordinate that you used into your table.
- Solve for all three (or five, if you want more) coordinates in this fashion.
-
7Graph the coordinates. Now that you have at least three complete coordinate pairs, mark them on your graph. Draw a connecting them all into a parabola, and you’re finished!
Graphing a Quadratic Inequality
-
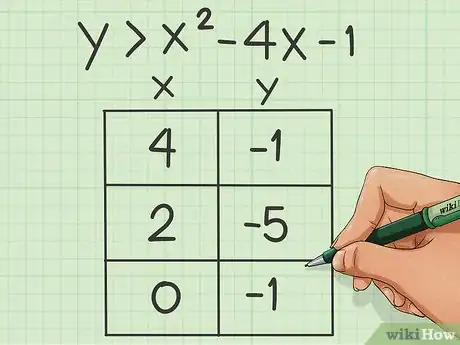
1Solve the quadratic formula. A quadratic inequality uses the same formula as the quadratic formula but will use an inequality symbol instead. For example, it will look like y<ax(squared)+bx+c. Using the complete steps from above in “Graphing a Quadratic Equation,” find three coordinates to graph your parabola.[19]
-
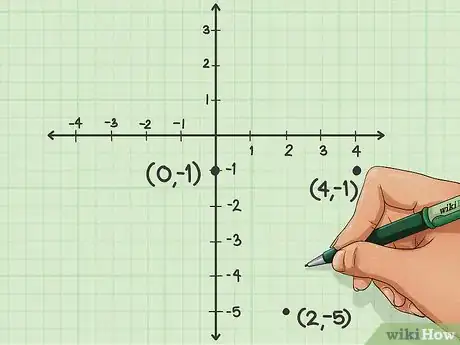
2Mark the coordinates on your graph. Although you have enough points to make your complete parabola, don’t draw the shape yet.[20]
-
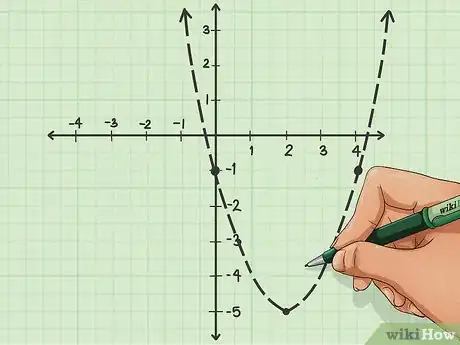
3Connect the points on your graph. Because you are graphing a quadratic inequality, the line you draw will be a bit different.
- If your inequality symbol was “greater than” or “less than” (> or <), then you will draw a dashed line between the coordinates.
- If your inequality symbol was “greater than or equal to” or “less than or equal to” (> or <), then the line you draw will be solid.
- End your lines with arrow points to show that the solutions extend beyond the range of your graph.
-
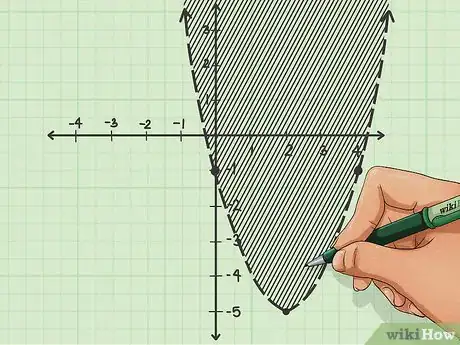
4Shade the graph. In order to show multiple solutions, shade the portion of the graph in which the solution could be found. To find out which part of the graph should be shaded, test a pair of coordinates in your formula. An easy set to use is (0,0). Note whether or not these coordinates lie within or outside of your parabola.
- Solve the inequality with the coordinates you’ve chosen. If we use an example of y>x(squared)-4x-1 and substitute the coordinates (0,0), then it will change to 0>0(squared)-4(0)-1.
- If the solution to this is true and the coordinates are inside the parabola, shade inside the parabola. If the solution is false, shade outside of the parabola.
- If the solution to this is true and the coordinates are outside the parabola, shade the outside of the parabola. If the solution is false, shade inside the parabola.[21]
Graphing an Absolute Value Equation
-
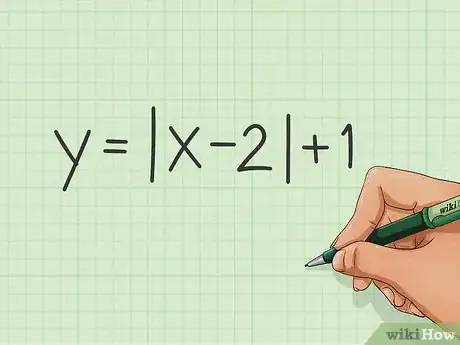
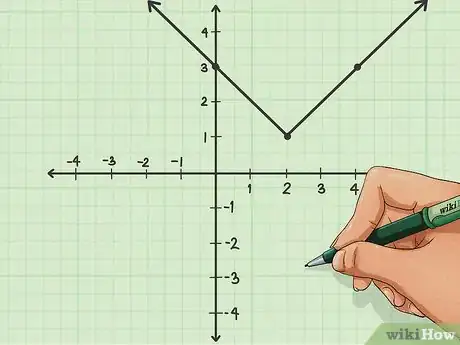
1Examine your equation. The most basic absolute value equation will appear as y=|x|. Other numbers or variables may be involved though.[22]
-
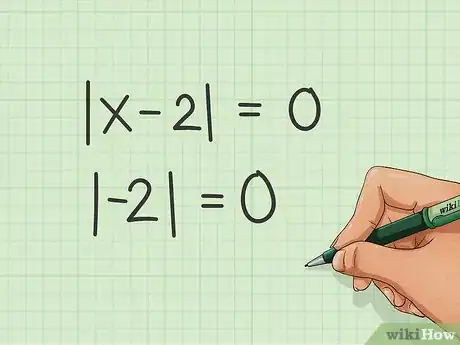
2Make the absolute value equal to 0. To do this, make everything in the absolute value lines | | =0. If we use the example y=|x-2|+1, then we get the absolute value by making |x-2|=0. Then the absolute value becomes 2.
- The absolute value is the number of points from |x| to ‘0’ on a number line. So the absolute value of |2| is 2, and the absolute value of |-2| is also two. This is because in both cases, ‘2’ and ‘-2’ are 2 steps away from zero on the number line.
- You may have an absolute value equation where ‘x’ is alone. In that case, the absolute value is ‘0’. For example, y=|x|+3 changes to y=|0|+3, which equals to ‘3’.
-
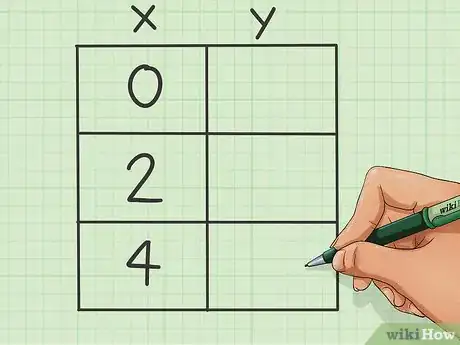
3Make a table. You want it to have three rows and two columns.[23]
- Put the first absolute value coordinate in the into the top center column for ‘X’.
- Choose two other numbers an equal distance from your x-coordinate in each direction (positive and negative). If |x|=0, then move up and down an equal number of spaces from ‘0’.
- You can choose any numbers, although ones that are near the x-coordinate are most helpful. They must also be whole numbers.
-
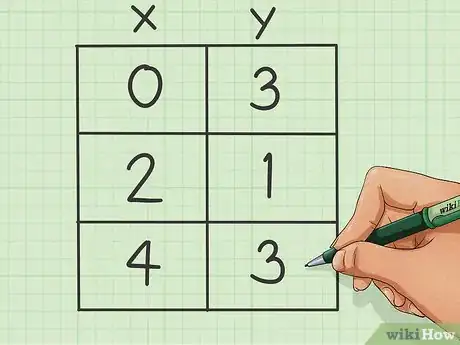
4Solve the inequality. You need to find the y-coordinate that pairs with the three x-coordinates you have. To do this, substitute the x-coordinate values into the inequality and solve for ‘y’. Fill these answers in on your table.
-
5Graph the points. You only need three points to graph an absolute value equation, but you can use more if you would like. An absolute value equation will always form a “V” shape on your graph. Add arrows to the ends to show that the line extends further than the edge of your graph.[24]
Community Q&A
-
QuestionHow do you graph an equation without Y?
 wikiHow Staff EditorThis answer was written by one of our trained team of researchers who validated it for accuracy and comprehensiveness.
Staff Answer wikiHow Staff EditorStaff AnswerIf you’re graphing a linear equation, you can calculate y if you know m (the slope of the line) and b (the point at which the line crosses the Y-axis. Input any number for the variable x to solve for y, using the equation y = mx + b. For example, if m = .5 and b = 5, then the input 3 for x would give you the output 6.5. You can then plot a point at 3 on the X-axis and 6.5 on the Y axis. Use 2 or 3 more inputs to plot the line on the graph.
 -
QuestionHow do you graph an equation without a graphing calculator?
 wikiHow Staff EditorThis answer was written by one of our trained team of researchers who validated it for accuracy and comprehensiveness.
Staff Answer wikiHow Staff EditorStaff AnswerFor most equations, you simply need to plot a few points on the graph by plugging in inputs and generating outputs. Then, you can draw a line through the points. Each input represents a position on the X-axis, while each output is positioned somewhere along the Y-axis. You would draw each dot between those two positions (for instance, if the input is 3 and the output is 6, line up your point so it’s directly above 3 on the X-axis and across from 6 on the Y-axis).
 -
QuestionHow do you graph an equation with a fraction?
 wikiHow Staff EditorThis answer was written by one of our trained team of researchers who validated it for accuracy and comprehensiveness.
Staff Answer wikiHow Staff EditorStaff AnswerFractions are located between points on the appropriate axis. For instance, if your input (x) = 1/2 and the output (y) = 1, you’d plot the point directly above the halfway point between 0 and 1 on the x-axis, and directly across from 1 on the y-axis.
References
- ↑ https://www.varsitytutors.com/hotmath/hotmath_help/topics/graphing-linear-equations
- ↑ https://www.varsitytutors.com/hotmath/hotmath_help/topics/graphing-linear-equations
- ↑ https://www.varsitytutors.com/hotmath/hotmath_help/topics/graphing-linear-equations
- ↑ https://www.youtube.com/watch?v=UgtMbCI4G_I
- ↑ https://www.brainpop.com/technology/computerscience/graphinglinearequations/
- ↑ https://www.mathplanet.com/education/algebra-1/linear-inequalities/solving-linear-inequalities
- ↑ https://www.mathplanet.com/education/algebra-1/linear-inequalities/solving-linear-inequalities
- ↑ https://www.ck12.org/algebra/graphs-of-inequalities-in-one-variable/lesson/Graphs-of-Inequalities-in-One-Variable-ALG-I/
- ↑ https://www.purplemath.com/modules/ineqgrph.htm
- ↑ https://www.purplemath.com/modules/ineqgrph.htm
- ↑ https://www.youtube.com/watch?v=P_-c9D6mjGA
- ↑ http://www.purplemath.com/modules/ineqgrph.htm
- ↑ https://www.mathsisfun.com/algebra/quadratic-equation-graphing.html
- ↑ https://www.mathsisfun.com/algebra/quadratic-equation-graphing.html
- ↑ https://www.mathsisfun.com/algebra/quadratic-equation-graphing.html
- ↑ https://www.mathsisfun.com/algebra/quadratic-equation-graphing.html
- ↑ https://www.texasgateway.org/resource/solving-quadratic-equations-using-tables
- ↑ https://www.varsitytutors.com/hotmath/hotmath_help/topics/graphing-quadratic-equations-using-factoring
- ↑ https://mathbitsnotebook.com/Algebra1/Inequalities/IQquadratics.html
- ↑ https://mathbitsnotebook.com/Algebra1/Inequalities/IQquadratics.html
- ↑ https://mathbitsnotebook.com/Algebra1/Inequalities/IQquadratics.html
- ↑ https://www.youtube.com/watch?v=R9AJGxAJ0QQ
- ↑ https://www.youtube.com/watch?v=R9AJGxAJ0QQ
- ↑ http://www.purplemath.com/modules/graphabs.htm
About This Article
To graph a linear equation, start by using the y equals mx plus b formula to find the y-intercept. For example, if y equals 2x minus 1, then the y-intercept would be negative 1. You’ll also need to find the slope, which would be 2/1, since it needs to be converted to a fraction. Next, draw your graph and place a point for the y-intercept, which would be negative 1 on the y axis. After that, plot your slope by beginning at the y-intercept, then moving up 2 and 1 to the right. Finally, connect the two points with a line. For more tips, like how to graph linear inequalities, read on!
