wikiHow is a “wiki,” similar to Wikipedia, which means that many of our articles are co-written by multiple authors. To create this article, 68 people, some anonymous, worked to edit and improve it over time.
There are 7 references cited in this article, which can be found at the bottom of the page.
This article has been viewed 333,074 times.
Learn more...
In order to graph points on the coordinate plane, you have to understand the organization of the coordinate plane and know what to do with those (x, y) coordinates. If you want to know how to graph points on the coordinate plane, just follow these steps.
Things You Should Know
- Start at (0, 0), or the origin, which is in the center of the coordinate plane.
- Move over x units to the right or left. Then, move over y units up or down. Mark the point.
- If you're working with a linear equation, draw lines connecting points from left to right. For a quadratic equation, connect points with curved lines.
Steps
Understanding the Coordinate Plane
-
1Understand the axes of the coordinate plane. When you're graphing a point on the coordinate plane, you will graph it in (x, y) form. Here is what you'll need to know:[1]
- The x-axis goes left and right, the second coordinate is on the y-axis.
- The y-axis goes up and down.
- Positive numbers go up or right (depending on the axis). Negative numbers go left or down.
-
2Understand the quadrants on the coordinate plane. Remember that a graph has four quadrants (typically labeled in Roman numerals). You will need to know which quadrant the plane is in.[2]
- Quadrant I gets (+,+); quadrant I is above and to the left of the y-axis.
- Quadrant IV gets (+,-); quadrant IV is below the x-axis and to the right of the y-axis. (5,4) is in quadrant I.
- (-5,4) is in Quadrant II. (-5,-4) is in Quadrant III. (5,-4) is in Quadrant IV.
Graphing a Single Point
-
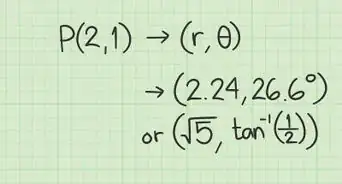
1Start at (0, 0), or the origin. Just go to (0, 0), which is the intersection of the x and y axes, right in the center of the coordinate plane.[3]
-
2Move over x units to the right or left. Let's say you're working with the set of coordinates (5, -4). Your x coordinate is 5. Since five is positive, you'll need to move over five units to the right. If it was negative, you would move over 5 units to the left.[4]
-
3Move over y units up or down. Start where you left off, 5 units to the right of (0, 0). Since your y coordinate is -4, you will have to move down four units. If it were 4, you would move up four units.[5]
-
4Mark the point. Mark the point you found by moving over 5 units to the right and 4 units down, the point (5, -4), which is in the 4th quadrant. You're all done.[6]
Following Advanced Techniques
-
1Learn how to graph points if you're working with an equation. If you have a formula without any coordinates, then you'll have to find your points by choosing a random coordinate for x and seeing what the formula spits out for y. Just keep going until you've found enough points and can graph them all, connecting them if necessary. Here's how you can do it, whether you're working with a simple line, or a more complicated equation like a parabola:[7]
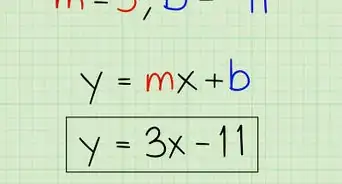
- Graph points from a line. Let's say the equation is y = x + 4. So, pick a random number for x, like 3, and see what you get for y. y = 3 + 4 = 7, so you have found the point (3, 7).
- Graph points from a quadratic equation. Let's say the equation of the parabola is y = x2 + 2. Do the same thing: pick a random number for x and see what you get for y. Picking 0 for x is easiest. y = 02 + 2, so y = 2. You have found the point (0, 2).
-
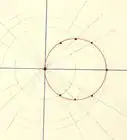
2Connect the points if necessary. If you have to make a line graph, draw a circle, or connect all of the points of a parabola or another quadratic equation, then you'll have to connect the points. If you have a linear equation, then draw lines connecting the points from left to right. If you're working with a quadratic equation, then connect the points with curved lines.[8]
- Unless you are only graphing a point, you will need at least two points. A line requires two points.
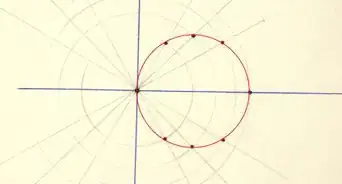
- A circle requires two points if one is the center; three if the center is not included (Unless your instructor has included the center of the circle in the problem, use three).
- A parabola requires three points, one being the absolute minimum or maximum; the other two points should be opposites.
- A hyperbola requires six points; three on each axis.
-
3Understand how modifying the equation changes the graph. Here are the different ways that modifying the equation changes the graph:[9]
- Modifying the x coordinate moves the equation left or right.
- Adding a constant moves the equation up or down.
- Turning it negative (multiplying by -1) flips it over; if it is a line, it will change it from going up to down or going down to up.
- Multiplying it by another number will either increase or decrease the slope.
-
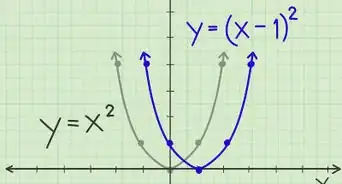
4Follow an example to see how modifying the equation changes the graph.[10] Consider the equation y = x^2 ; a parabola with its base at (0,0). Here are the differences you will see as you modify the equation:
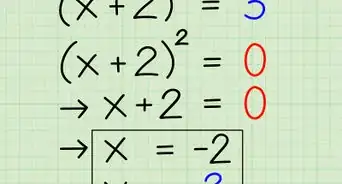
- y = (x-2)^2 is the same parabola, except it is graphed two spaces to the right of the origin; its base is now at (2,0).
- y = x^2 + 2 is still the same parabola, except now it is graphed two spaces higher at (0,2).
- y = -x^2 (the negative is applied after the exponent ^2) is an upside down y = x^2; its base is (0,0).
- y = 5x^2 is still a parabola, but it gets larger even faster, giving it a thinner look.
Community Q&A
-
QuestionHow do I graph y=3x?
 Community AnswerSubstitute the x values on your cartesian plan into your equation, which will give you the corresponding y values. You can then plot it onto your graph.
 -
QuestionWhat do the (+,+), (-,-), (+,-), and (-,+) notations indicate on a coordinate graph?
 Community AnswerThese notations indicate whether the x and y coordinates of a graphed point are positive or negative. You can use this information to determine the graph quadrant in which a point appears. Quadrant I (upper right) is (+,+), quadrant II (upper left) is (-,+), quadrant III (lower left) is (-,-), and quadrant IV (lower right) is (+,-).
 -
QuestionHow do I draw the graph of 3y=2x?Community AnswerSolve the equation for y; y will equal 2/3 x. Pick several values for x. Multiply each value of x by 2/3 (for example, if x= 2 then y will be 2/3 times 2 or 4/3). Once you have done this for all of your x values, you are ready to graph. Locate your first x value on the horizontal axis and go up to the y value you calculated and make a small dot. Do this for each x value--connect the dots with a smooth line or curve as (in this case, it will be a line).

References
- ↑ https://www.mathplanet.com/education/algebra-1/visualizing-linear-functions/the-coordinate-plane
- ↑ https://www.mathplanet.com/education/algebra-1/visualizing-linear-functions/the-coordinate-plane
- ↑ http://www.virtualnerd.com/algebra-1/relations-functions/coordinate-plane/coordinate-plane-graphing/coordinate-plane-graph-points-example
- ↑ https://www.khanacademy.org/math/basic-geo/basic-geo-coord-plane/coordinate-plane-4-quad/v/plot-ordered-pairs
- ↑ https://www.chilimath.com/lessons/introductory-algebra/plotting-points-graph-xy-plane/
- ↑ https://math.libretexts.org/Courses/Lumen_Learning/Book%3A_Beginning_Algebra_(Lumen)/02%3A_Graphing/2.02%3A_The_Coordinate_Plane
- ↑ https://www.varsitytutors.com/hotmath/hotmath_help/topics/graphing-linear-equations
- ↑ https://math.libretexts.org/Courses/Lumen_Learning/Book%3A_Beginning_Algebra_(Lumen)/02%3A_Graphing/2.02%3A_The_Coordinate_Plane
- ↑ https://www.varsitytutors.com/hotmath/hotmath_help/topics/graphing-linear-equations
About This Article
To graph a point on the coordinate plane, take a look at your coordinates, which should be two numbers within parenthesis, separated by a comma. The first number is the location of the point on the x-axis, and the second is the location of the number on the y-axis. A positive number means you move to the right on the x-axis or up on the y-axis, while a negative number means you move left on the x-axis and down on the y-axis. For example, to plot (5, -4), move 5 spaces to the right and 4 spaces down. To learn how to graph an equation on the coordinate plane, read on!