X
wikiHow is a “wiki,” similar to Wikipedia, which means that many of our articles are co-written by multiple authors. To create this article, volunteer authors worked to edit and improve it over time.
This article has been viewed 30,540 times.
Learn more...
Star charts have been in use since antiquity. Usually, they are drawn as circles, with the pole in the middle and the equator near the edge.
Steps
-
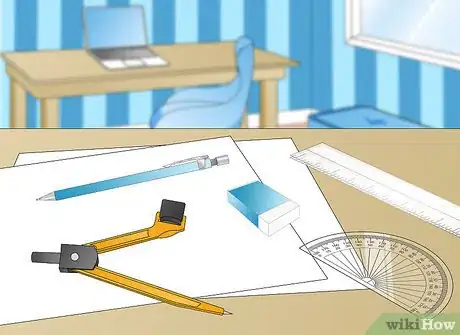
1Get the stuff you need. You will need:
- A large piece of paper.
- A set of giant compasses.
- A 30 cm (or larger) ruler.
- A protractor.
- A pencil and an eraser.
- The co-ordinates of the stars that you want on your chart - available online.
-
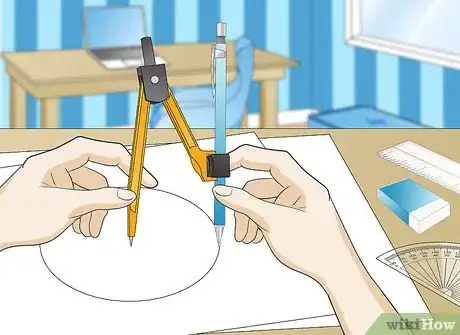
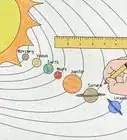
2Draw a big circle. If your paper is large enough (and I'm assuming it is) draw a circle with a radius of one foot.Advertisement
-
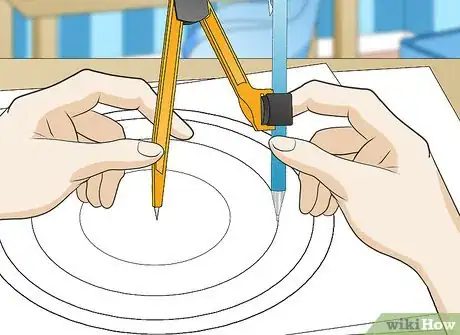
3Draw concentric circles. The circles should have radii of 1 inch, 2, 3, 4, 5, 6, 7, 8, 9, 10 and 11 inches, and the centres should be in the same place as the centre of the big circle.
-
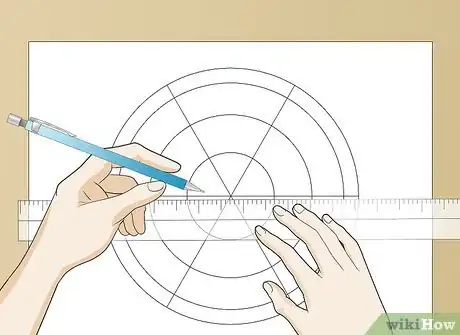
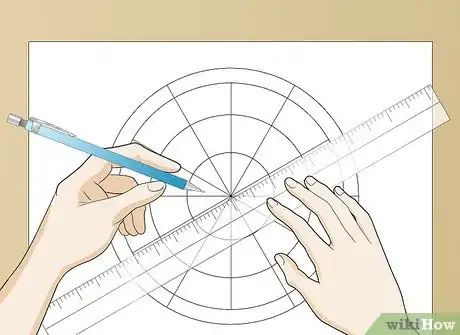
4Draw radii. From the centre of the circle, draw six radii, at 0 degrees, 60, 120, 180, 240 and 300 degrees.
-
5Draw six radii from the edge of the 1 inch circle to the edge of the one foot circle, at 30 degrees, 90, 150, 210, 270 and 330 degrees.
-
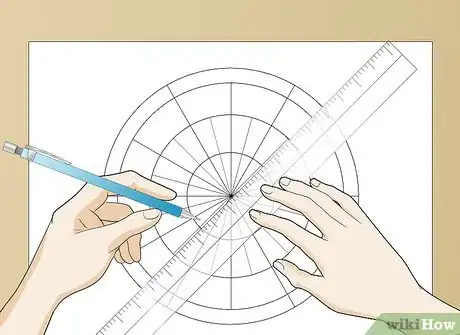
6Draw twelve radii from the edge of the 2 inch circle to the edge of the one foot circle, at 15 degrees, 45, 75, 105, 135, 165, 195, 225, 255, 285, 315 and 345 degrees.
-
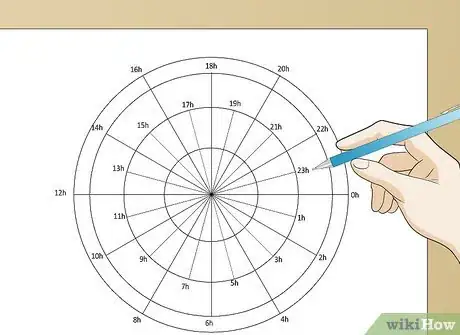
7Mark on the co-ordinates. Where the 0 degree radius meets the one foot circle, write 0h. Going clockwise (anticlockwise if you are mapping the southern hemisphere), the other radius-circle meeting points are 1h, 2h, 3h, and so on, up to 23h. These are now the names of the radii, e.g. the 15h radius. At the point where the radii meet, in the middle, write 90. If you're mapping the northern hemisphere, write +90, southern hemisphere: -90. Moving outwards, label the circles as +80, +70, +60, +50, +40, +30, +20, +10, 0, -10, -20, and the outer circle should be -30. If you're mapping the southern hemisphere, change + to - and - to +.
-
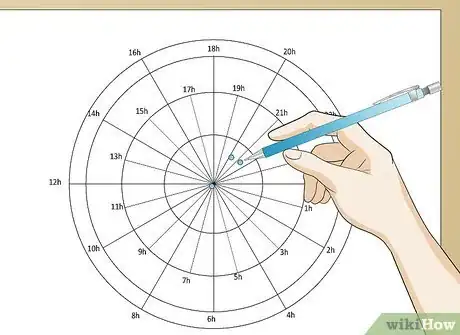
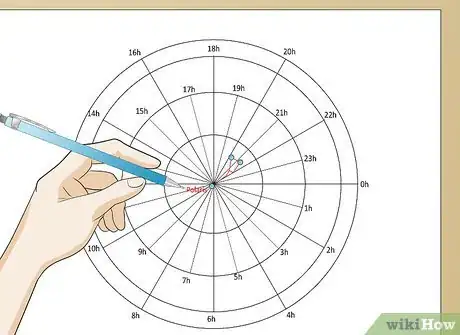
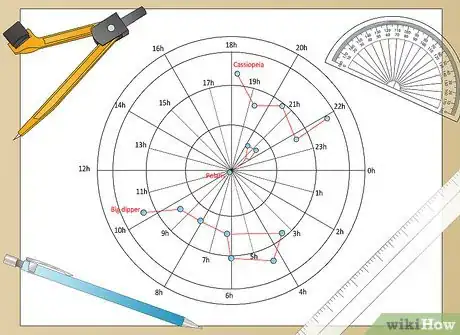
8The co-ordinates of stars are given as declination, in degrees, and right ascension, in hours. You can find the co-ordinates on the internet. To plot a star, start at the middle. Move outwards, along the 0h radius, until you are at the correct declination. Then, move clockwise until you are at the correct right ascension. Draw a dot to mark the star. You may wish to connect the stars in each constellation so that you can see the patterns.
-
9If you have enough space after plotting the stars, you can write information about each one next to it. If you can, write the star's magnitude (how bright it is), name and designation.
-
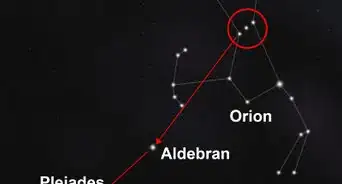
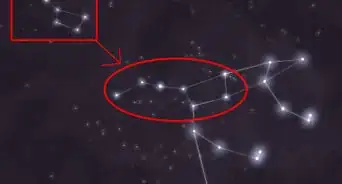
10Now it's time to use your star chart. Firstly, you need to find some stars that you know, so you can find them on your chart. For northerners, I'd recommend the big dipper or Cassiopeia. For southerners, I'd recommend Carina or Centaurus. Once you've found where you are on the chart, it will show you where other stars are, in relation to the ones you've found.
Advertisement
Community Q&A
-
QuestionI'm a little confused. Starting from the outside, is it 1 inch, 2 inches, 3 inches, and 6 inches? Or is it 1 inch, 2 inches, 4 inches, and 5 inches?
 TomPNTop AnswererThe people who did the pictures got it wrong. You draw the lines starting from the center, not the edge, so it would be starting from the middle, not the outside.
 -
QuestionI'm a little confused. Are all of the concentric circles 1 in between and that's just the distance they are from the center?
 TomPNTop AnswererYes, exactly. There should be a 1 inch gap in between each circle, and the distances given are how far each circle should be from the center.
Advertisement
Warnings
- Don't draw planets on your map! Planets move around, so if you plot them on your chart, they'll be in the wrong place after a couple of weeks.⧼thumbs_response⧽
Advertisement
About This Article
Advertisement
