This article was co-authored by wikiHow Staff. Our trained team of editors and researchers validate articles for accuracy and comprehensiveness. wikiHow's Content Management Team carefully monitors the work from our editorial staff to ensure that each article is backed by trusted research and meets our high quality standards.
The wikiHow Tech Team also followed the article's instructions and verified that they work.
This article has been viewed 245,522 times.
Learn more...
This wikiHow teaches you how to use Adobe Illustrator to make a pie chart.
Steps
-
1Open or create a file in Adobe illustrator. To do so click on the yellow and brown app that contains the letters "Ai," then click on File in the menu bar in upper-left of the screen, and:
- Click New… to create a new file; or
- Click on Open… to add a pie chart to an existing document.
-
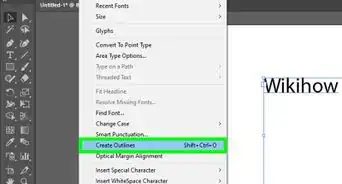
2Long-click and release on the "Graph" Tool. It's near the bottom of the toolbar, on the right side.
- A drop-down menu will open to the right of the toolbar.
Advertisement -
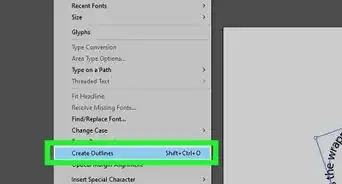
3Click on the Pie Graph Tool. It's near the bottom of the drop-down menu.
-
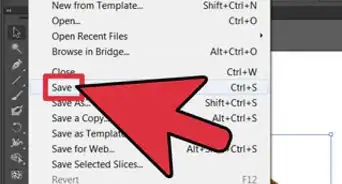
4Click anywhere on the workspace and drag the crosshairs. Do so until the square is about the size of the pie chart you wish to create.
-
5Release the click. A pie chart will appear along with a dialog box that contains the table in which to enter your data.
-
6Enter your data in the table. To do so, click on a cell and then type the value you want to represent in the pie chart. Press Tab ↹ to move to the next cell.
- Each horizontal row represents a single pie chart. If you type data in any row but the top one, additional pie charts will be created.
- Each vertical column represents the data that will create the "slices" of the pie chart. For example, enter 30 in the top row of the first column, 50 in the second column, and 20 in the third column, and you'll get a pie chart with three slices representing 30%, 50%, and 20%.
- Use the scroll bars on the bottom and right sides of the dialog box to reveal more cells.
-
7Click on ☑️ to apply your data to the pie chart. It's in the upper-right corner of the dialog box.
-
8Close the table. When you're satisfied with the pie chart, close the dialog box by clicking on the X (Windows) or red dot (Mac) in the corner of the dialog box.
-
9Click on Save. The pie chart will be created according to the data you entered.
- To change the colors on your pie chart:
- Click on the Direct Selection Tool. It's the light gray pointer at the top-right of the tool bar.
- Click on a section of the pie chart.
- Click on a color in the "Color" window. Repeat for every section whose color you want to change.
- If you don't see the "Color" window, click on Window in the menu bar, then click on Color.
- Click on the menu in the upper-right corner of the "Color" window to display the available color options.


About This Article

1. Long-click and release the graph tool.
2. Click Pie Graph Tool.
3. Click the workspace and drag the crosshairs.
4. Release the click to draw the chart.
5. Enter the chart data.
6. Click the check mark.