wikiHow is a “wiki,” similar to Wikipedia, which means that many of our articles are co-written by multiple authors. To create this article, 67 people, some anonymous, worked to edit and improve it over time.
wikiHow marks an article as reader-approved once it receives enough positive feedback. This article received 26 testimonials and 82% of readers who voted found it helpful, earning it our reader-approved status.
This article has been viewed 854,790 times.
Learn more...
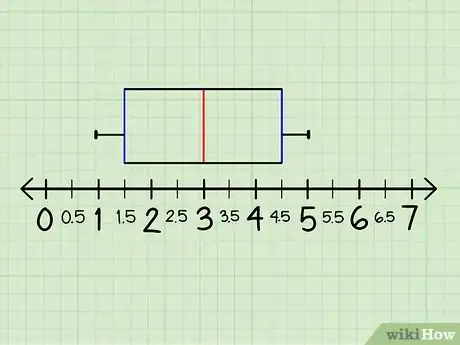
A box and whisker plot is a diagram that shows the statistical distribution of a set of data. This makes it easy to see how data is distributed along a number line, and it’s easy to make one yourself!
Steps
-
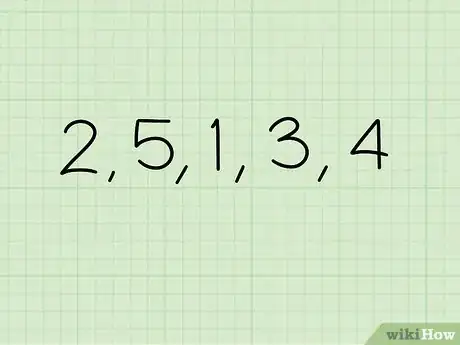
1Gather your data. Let's say we start the numbers 1, 3, 2, 4, and 5. These will be used for calculation examples.
-
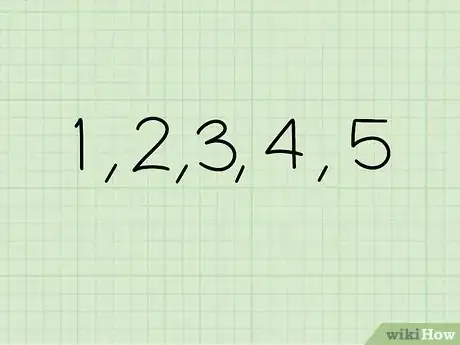
2Organize the data from least to greatest. Take all your numbers and line them up in order, so that the smallest numbers are on the left and the largest numbers are on your right. In our case, the order of the numbers is 1, 2, 3, 4, and 5.[1]Advertisement
-
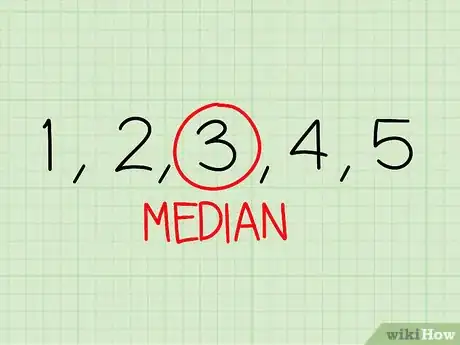
3Find the median of the data set. The median is the middle number in the data set when the data set is written from least to greatest. (This is why we lined up all the numbers in Step 2.) For the data set in our example, 3 is the number that's exactly in the middle, and therefore is our median. The median is also called the second quartile.[2]
- In a data set with an odd amount of numbers, the median will always have the same amount of numbers on either side of it. For the data set 1, 2, 3, 4, 5, the median number, 3, has 2 numbers before it and 2 numbers after it. That's how we can be sure that it's our median.
- What if the data set you're working with has an even amount of numbers? What if you had to find the median of 2, 4, 4, 7, 9, 10, 14, 15? You find the median here by taking the two middle numbers and finding their average. In our example, you would take 7 and 9 — the two middle numbers — add them up and divide them by 2. 7 + 9 equals 16, and 16 divided by 2 equals 8. The median of this data set would be 8.
-
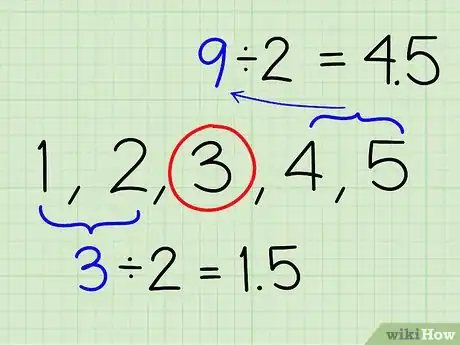
4Find the first and third quartiles. We've already found the second quartile of the data set, which is our median. Now we need to find the median of the lower half of the data set; in our example it would be the median of the two numbers to the left of 3. The median of 1 and 2 is (1 + 2) / 2 = 1.5. Do the same to find the median of the two numbers to the right of 3. (4 + 5) / 2 = 4.5.[3]
-
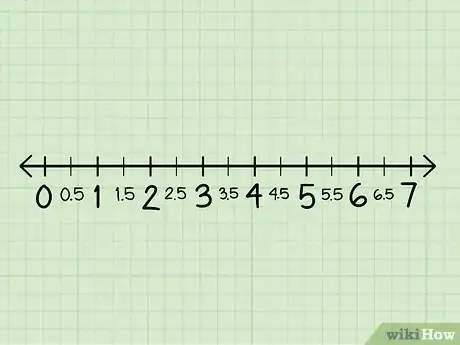
5Draw a plot line. This should be long enough to contain all of your data, plus a little extra on either side. Make sure to place the numbers at even intervals. If you're dealing with decimals, such as 4.5 and 1.5, be sure to label them as well.
-
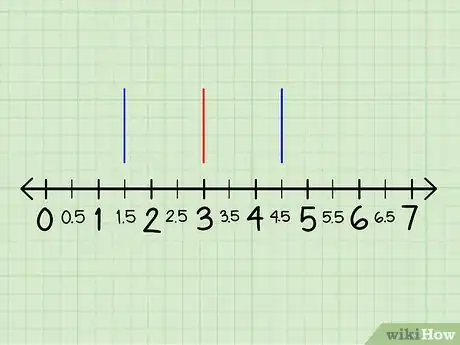
6Mark your first, second, and third quartiles on the plot line. Take the values of your first, second, and third quartiles and make a mark at those numbers on the plot line. The mark should be a vertical line at each quartile, starting slightly above the plot line.[4]
-
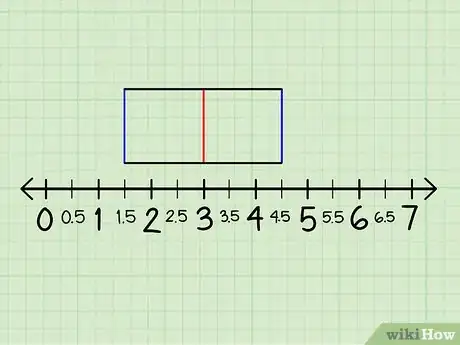
7Make a box by drawing horizontal lines connecting the quartiles. Connect the top or the first quartile to the top of the third quartile, going through the second quartile. Connect the bottom of the first quartile to the bottom of the third quartile, making sure to go through the second quartile.[5]
-
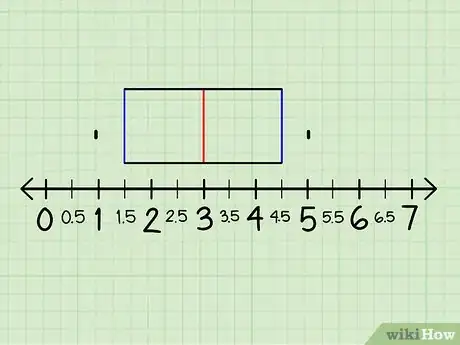
8Mark your outliers. Find the smallest, and then the largest, numbers in your data set and mark them on the plot line. Mark these points with a small dot. In the case of our example, the lower outlier is 1 and the upper outlier is 5.[6]
-
9Connect your outliers to the box with a horizontal line. The straight line that connects the outliers is informally called the "whiskers" of the box and whiskers plot.[7]
-
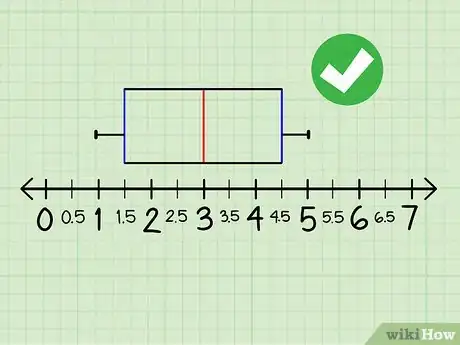
10Finished. Look at a box and whiskers plot to visualize the distribution of numbers in any data set. You can easily see, for example, whether the numbers in the data set bunch more in the upper quartile by looking at the size of the upper box, as well as the size of the upper whisker. Box and whisker plots are great alternatives to bar graphs and histograms.[8]
Community Q&A
-
QuestionHow do you know what the upper quadrant is?
 Community AnswerThe upper quadrant would be the set of numbers to the right of your median, if they are in order from least to greatest.
 -
QuestionWhat if I have an even amount of numbers, and the two middle numbers are the same?
 Community AnswerThe median is the middle number or the average of the two numbers if you have an even amount of numbers. If you have two that are the same, you do not need to average since they are the same. If they weren't, you would average the two to get the median.
 -
QuestionWhat's the lower extreme?
 Community AnswerThe lower extreme should be the lowest number in the data set, or the minimum number.
References
- ↑ https://www.khanacademy.org/math/statistics-probability/summarizing-quantitative-data/box-whisker-plots/a/box-plot-review
- ↑ https://www.khanacademy.org/math/statistics-probability/summarizing-quantitative-data/box-whisker-plots/a/box-plot-review
- ↑ https://www.khanacademy.org/math/statistics-probability/summarizing-quantitative-data/box-whisker-plots/a/box-plot-review
- ↑ https://www150.statcan.gc.ca/n1/edu/power-pouvoir/ch12/5214889-eng.htm
- ↑ https://asq.org/quality-resources/box-whisker-plot
- ↑ https://www150.statcan.gc.ca/n1/edu/power-pouvoir/ch12/5214889-eng.htm
- ↑ https://asq.org/quality-resources/box-whisker-plot
- ↑ https://courses.lumenlearning.com/introstats1/chapter/box-plots/
About This Article
To make a box and whisker plot, start by organizing the numbers in your data set from least to greatest and finding the median. Then, find the first quartile, which is the median of the beginning of the data set, and the third quartile, which is the median of the end of the data set. Once you've done that, draw a plot line and mark the quartiles and the median on it. Finally, connect the quartiles and median with horizontal lines to make a box, and then mark the outliers. To learn how to interpret a box and whisker plot, scroll down!
